Why Productive Use Beats Large Population
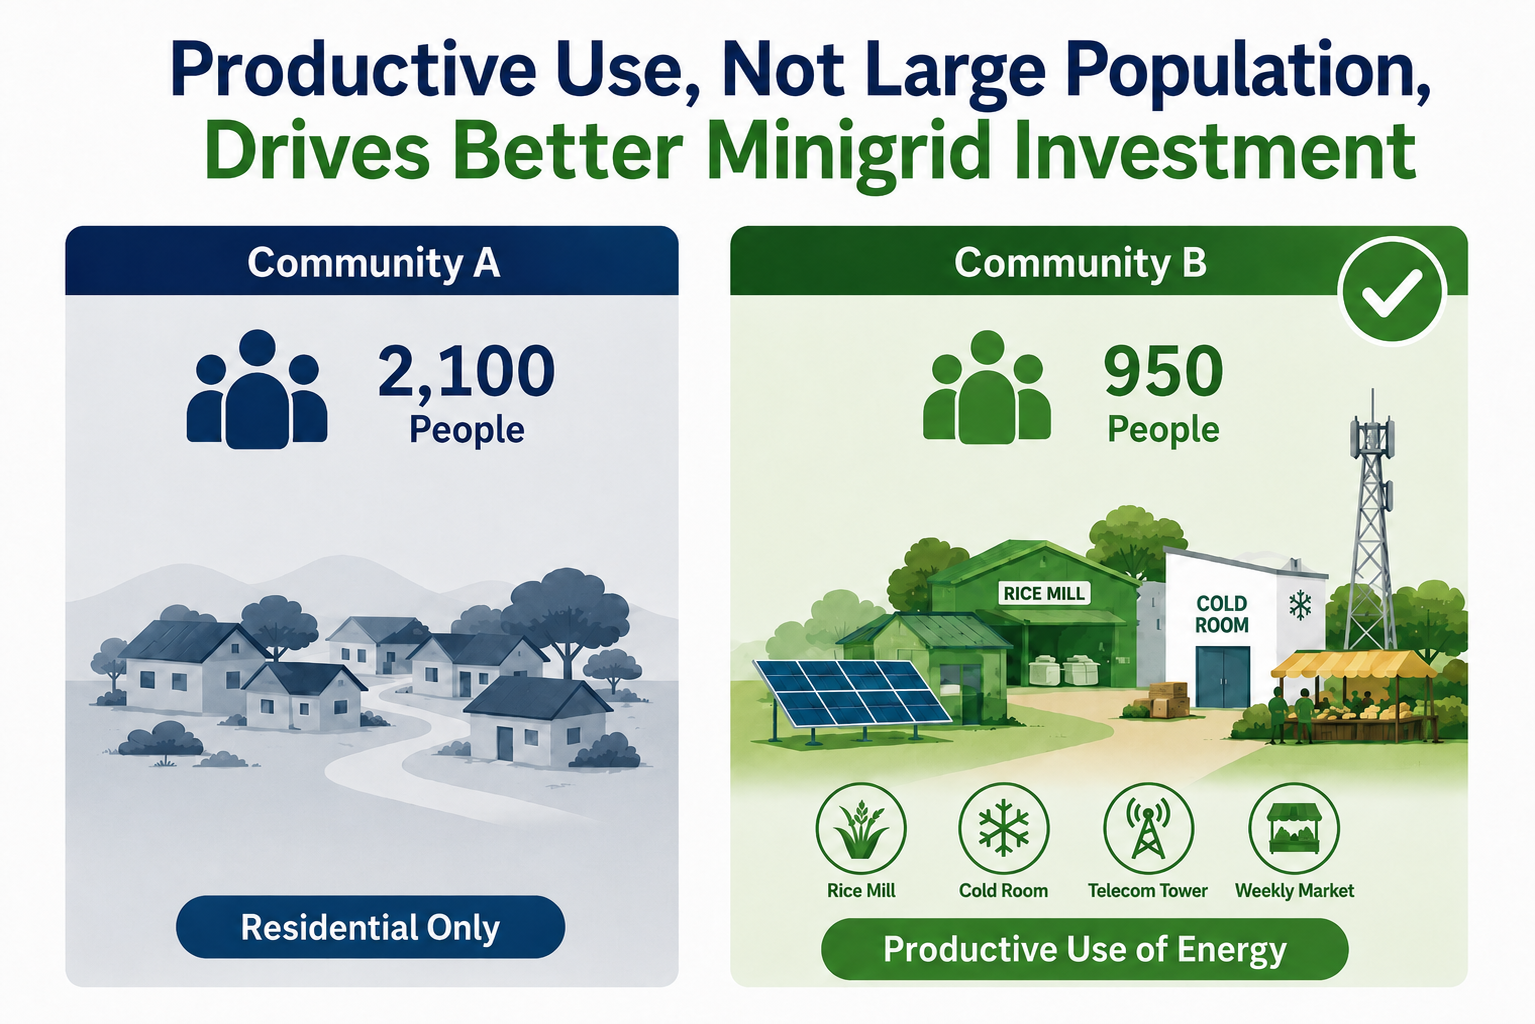
A benchmarked two-community case study showing why demand density — not large population — determines minigrid viability: the village of 950 with a rice mill and telecom tower beats the village of 2,100 without them on every metric that matters.
Region
West Africa
Technology
Solar PV
Why Productive Use Beats Population: A Two-Community Minigrid Case Study
Theme: Site selection and demand assessment in minigrid development
Benchmarks used: ESMAP Mini Grids for Half a Billion People (2019/2022), AMDA Benchmarking Africa's Minigrids (BAM 2020, 2022, 2024), Nigeria Electrification Project (NEP) cost norms
Conventional wisdom in electrification planning says "go where the people are." Population is the easiest variable to see on a map, so it dominates early-stage site screening. But minigrid economics are driven by energy demand, load shape, and revenue density — not headcount.
This case study models two archetypal unelectrified communities:
- Community A has 2.2× the population of Community B.
- Community B delivers roughly 3× the daily energy demand, 3.5–4× the annual revenue, and less than half the levelized cost of electricity (LCOE).
The difference is entirely explained by productive use of energy (PUE), anchor loads, settlement density, and grid distance.
The Two Communities at a Glance
| Parameter | Community A | Community B |
|---|---|---|
| Population | 2,100 | 950 |
| Estimated households (avg. 7 persons/HH) | ~300 | ~135 |
| Economic activity | Mostly residential; 1 primary school, small kiosks | Rice mill, 2 welding workshops, cold room, health centre, weekly market, telecom tower |
| Settlement pattern | Widely dispersed | Compact |
| Distance to existing grid | 6 km | 18 km |
| Estimated connections | ~306 | ~167 |
At the screening stage, A looks like the "bigger" opportunity — more people, more potential connections. The demand assessment tells a different story.
Demand Build-Up (Bottom-Up Load Assessment)
Community A: Residential-Dominated Demand
| Load segment | Count | Avg. consumption | Daily energy |
|---|---|---|---|
| Residential (Tier 1–2: lighting, phone charging, fan, TV in some HHs) | 300 | 0.35–0.45 kWh/day | ~120 kWh/day |
| Primary school (daytime lighting, fans, a few devices) | 1 | 5 kWh/day | 5 kWh/day |
| Small kiosks / informal commercial | 5 | 1 kWh/day | 5 kWh/day |
| Total | ~130 kWh/day |
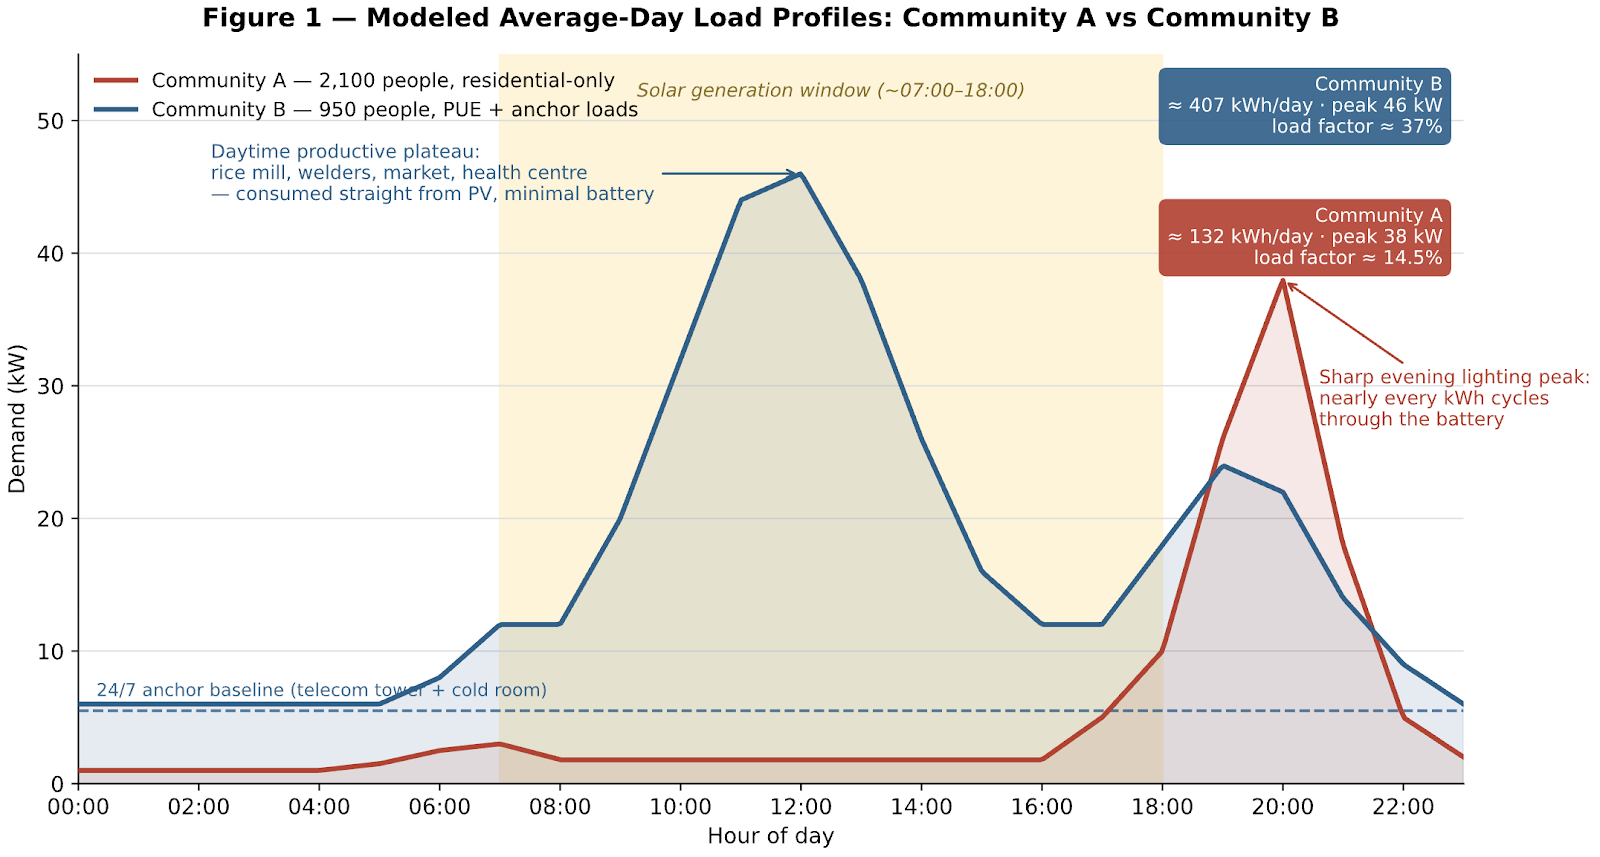
- Peak load: ~38 kW (sharp 18:30–21:30 evening lighting peak, high coincidence)
- Annual energy: ~47 MWh
- Load factor: ~14–15%
Community B: Anchor + Productive + Residential Demand
| Load segment | Rating / count | Operating pattern | Daily energy |
|---|---|---|---|
| Rice mill | ~20 kW | 5–6 hrs/day, daytime (seasonal peaks at harvest) | ~110 kWh/day |
| Welding workshops | 2 × 5 kW | 3–4 hrs/day, daytime | ~35 kWh/day |
| Cold room | ~5 kW | 24 hrs, ~60% duty cycle | ~70 kWh/day |
| Telecom tower (contracted anchor, ESCO/power-purchase model) | ~2.5 kW | 24/7 continuous | ~60 kWh/day |
| Health centre (vaccine fridge, lighting, diagnostics, staff quarters) | — | Day + night baseline | ~15 kWh/day |
| Market stalls, shops, barbers, grinding (weekly market uplift averaged) | ~30 | Daytime-weighted | ~45 kWh/day |
| Residential | 135 | 0.5 kWh/day (higher appliance uptake near commerce) | ~68 kWh/day |
| Total | ~400 kWh/day |
- Peak load: ~48 kW (broad daytime productive plateau plus moderate evening peak — a much flatter profile)
- Annual energy: ~146 MWh
- Load factor: ~35–40%
Key observation: Community B has 45% of A's population but ~3.1× its daily energy demand. Two anchor loads alone — the telecom tower and cold room — consume as much electricity as all 300 households in Community A combined, and they consume it 24 hours a day at near-perfect payment reliability.
Load Profile
Why load shape matters so much in a solar-battery system:
- Community A's demand is evening-peaked. Nearly all energy must pass through the battery (generated at noon, consumed at 20:00). Batteries are the most expensive and shortest-lived component, so every kWh is effectively "double-built."
- Community B's demand is daytime-heavy. The rice mill, welders, cold room, market, and health centre consume solar generation directly ("sun-following" load), shrinking the required battery bank per kWh delivered.
- The telecom tower and cold room provide a 24/7 base load, raising utilization of every asset in the system and providing contracted, bankable revenue.
| Metric | Community A | Community B |
|---|---|---|
| Load factor | ~14% | ~38% |
| Share of energy consumed in daylight hours | ~25% | ~60% |
| Share of demand from contracted/anchor customers | 0% | ~33% |
System Sizing and Capital Cost
| Component | Community A | Community B |
|---|---|---|
| Solar PV | ~55 kWp | ~120 kWp |
| Battery storage (Li-ion) | ~140 kWh (evening-dominated) | ~210 kWh (proportionally smaller vs. demand) |
| Inverter / plant balance | 40 kVA | 60 kVA (+ backup genset for milling season) |
| Distribution network | ~12 km LV (dispersed housing) | ~4 km LV (compact settlement) |
| Connections + metering | 306 × ~$150 | 172 × ~$150 |
| Indicative total capex | ~$350,000 | ~$370,000 |
| Capex per connection | ~$1,150 | ~$2,150 |
| Capex per annual kWh served | ~$7.4/kWh-yr | ~$2.5/kWh-yr |
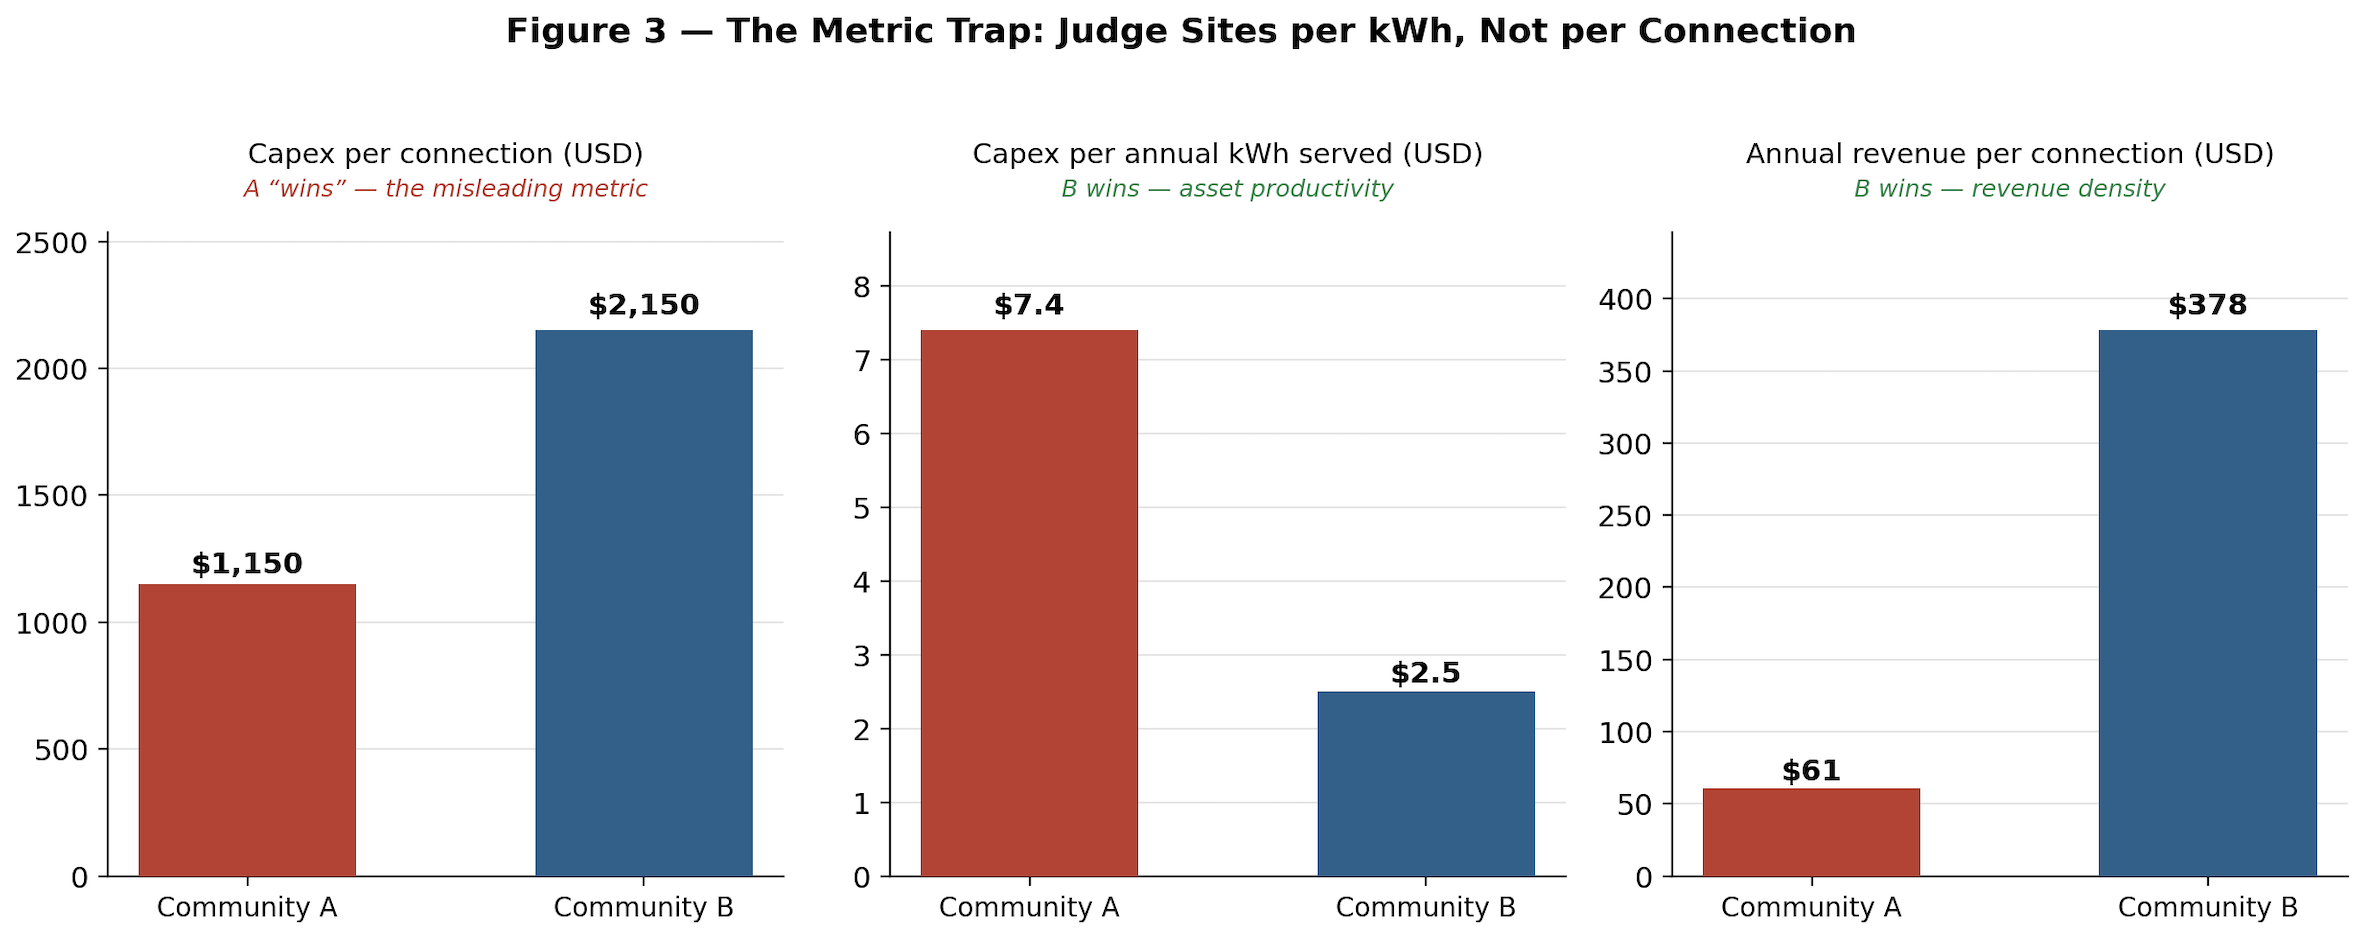
Two things stand out:
- Dispersed settlement is a silent capex killer. Community A needs roughly three times the LV line length to reach fewer paying kilowatt-hours. Reticulation for scattered compounds can rival generation cost.
- Capex per connection is the wrong lens. A looks "cheaper" per connection ($1,150 vs $2,150). But per unit of energy actually sold — the thing that generates revenue — B's infrastructure is ~3× more productive. This is exactly why the sector's benchmarking conversation (AMDA BAM, ESMAP) has been shifting from connection counts toward utilization and consumption metrics.
Revenue and Unit Economics
Assumptions: cost-reflective blended tariff of ~$0.50/kWh (residential) and ~$0.40/kWh (anchor/PUE contracts); collection efficiency 95% (smart metering, PAYG).
Community A
| Item | Value |
|---|---|
| Blended ARPU (residential-only site) | ~$5/month |
| Annual revenue | ~$18,500 |
| Annual site opex (staff, security, O&M across a dispersed network) | ~$16,000 |
| Annual operating margin | ~$2,500 |
| Simple capex payback | >100 years (effectively never) |
| Indicative LCOE | ~$1.20–1.35/kWh |
The ARPU figure is consistent with sector data: AMDA's benchmarking showed sector-wide ARPU of just $4.29/month in its 2020 report, rising to $8.30/month for mature (pre-2019) sites by the 2022 report — and that improvement was driven substantially by commercial and productive customers, which Community A lacks. A tariff high enough to recover A's true LCOE (~$1.30/kWh) would be unaffordable and would suppress the little demand that exists — the classic low-consumption death spiral.
Community B
| Item | Value |
|---|---|
| Telecom tower contract | ~$700/month |
| Rice mill | ~$1,300/month (seasonal average) |
| Cold room + welders + health centre | ~$1,600/month |
| Market/commercial customers (~30) | ~$900/month |
| Residential (135 HHs, ARPU ~$7) | ~$950/month |
| Annual revenue | ~$65,000 |
| Annual site opex | ~$27,000 |
| Annual operating margin | ~$38,000 |
| Simple payback on total capex | ~10 years; ~4–5 years on equity under a NEP-style performance-based grant covering ~50–60% of capex |
| Indicative LCOE | ~$0.50–0.55/kWh |
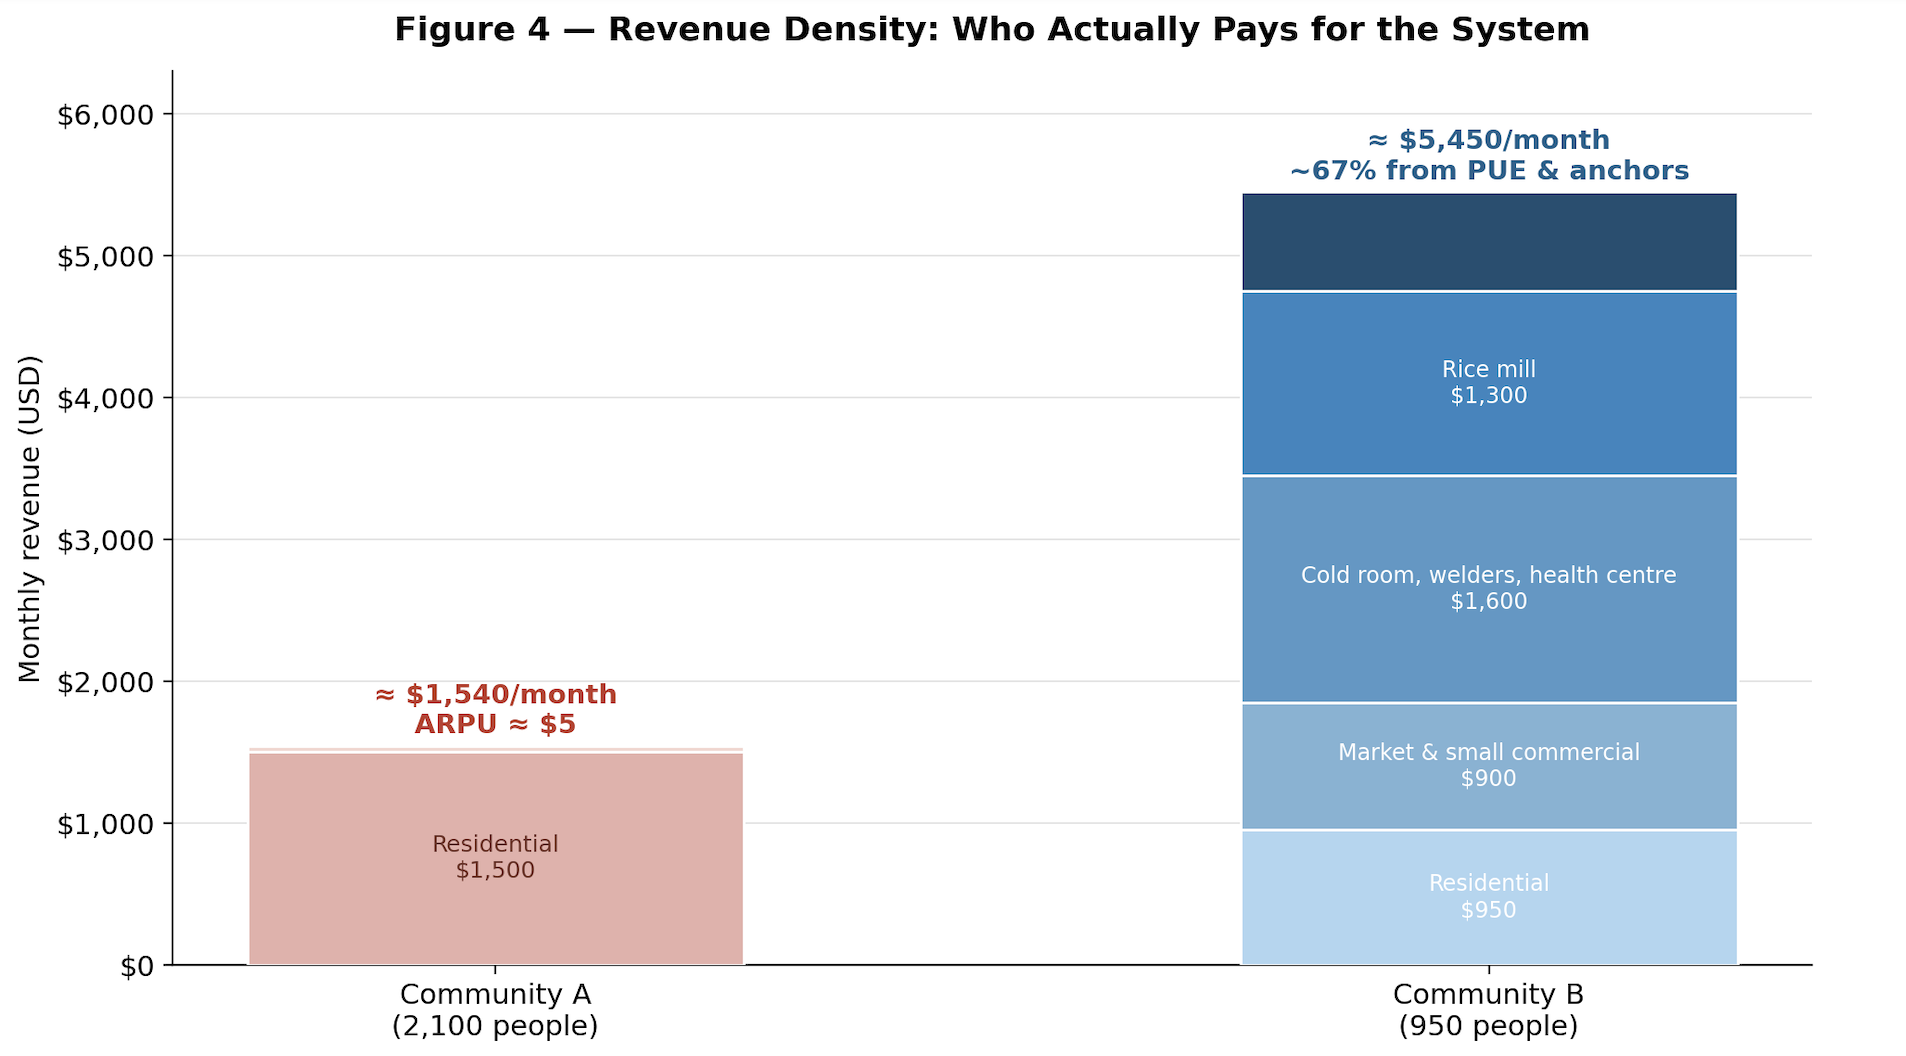
Revenue concentration check: ~33% of B's revenue comes from two contracted anchors (tower + mill). That is a manageable risk profile — the tower is typically a creditworthy telco/ESCO counterparty, and the mill's demand is tied to the local agricultural economy the minigrid itself strengthens.
Head-to-Head
| Metric | Community A | Community B | B ÷ A |
|---|---|---|---|
| Population | 2,100 | 950 | 0.45× |
| Daily energy demand | ~130 kWh | ~400 kWh | 3.1× |
| Load factor | ~14% | ~38% | 2.7× |
| Annual revenue | ~$18.5k | ~$65k | 3.5× |
| Operating margin | ~$2.5k | ~$38k | 15× |
| LCOE | ~$1.30/kWh | ~$0.52/kWh | 0.4× |
| Revenue per km of LV line | ~$1,550/km-yr | ~$16,000/km-yr | 10× |
8. What Would Change the Verdict?
Intellectual honesty requires stress-testing the conclusion:
- PUE stimulation in Community A. If a developer deploys appliance financing, agro-processing equipment leasing, or attracts a milling anchor, A's economics improve materially — ESMAP's load-factor curve works in both directions. But this means creating the demand B already has, adding cost, time, and execution risk to the project.
- Willingness/ability to pay. If B's rice mill is diesel-powered and its owner is satisfied with diesel economics, conversion is not automatic. Demand assessment must verify current energy spend (diesel litres/week is the single best proxy) and switching willingness.
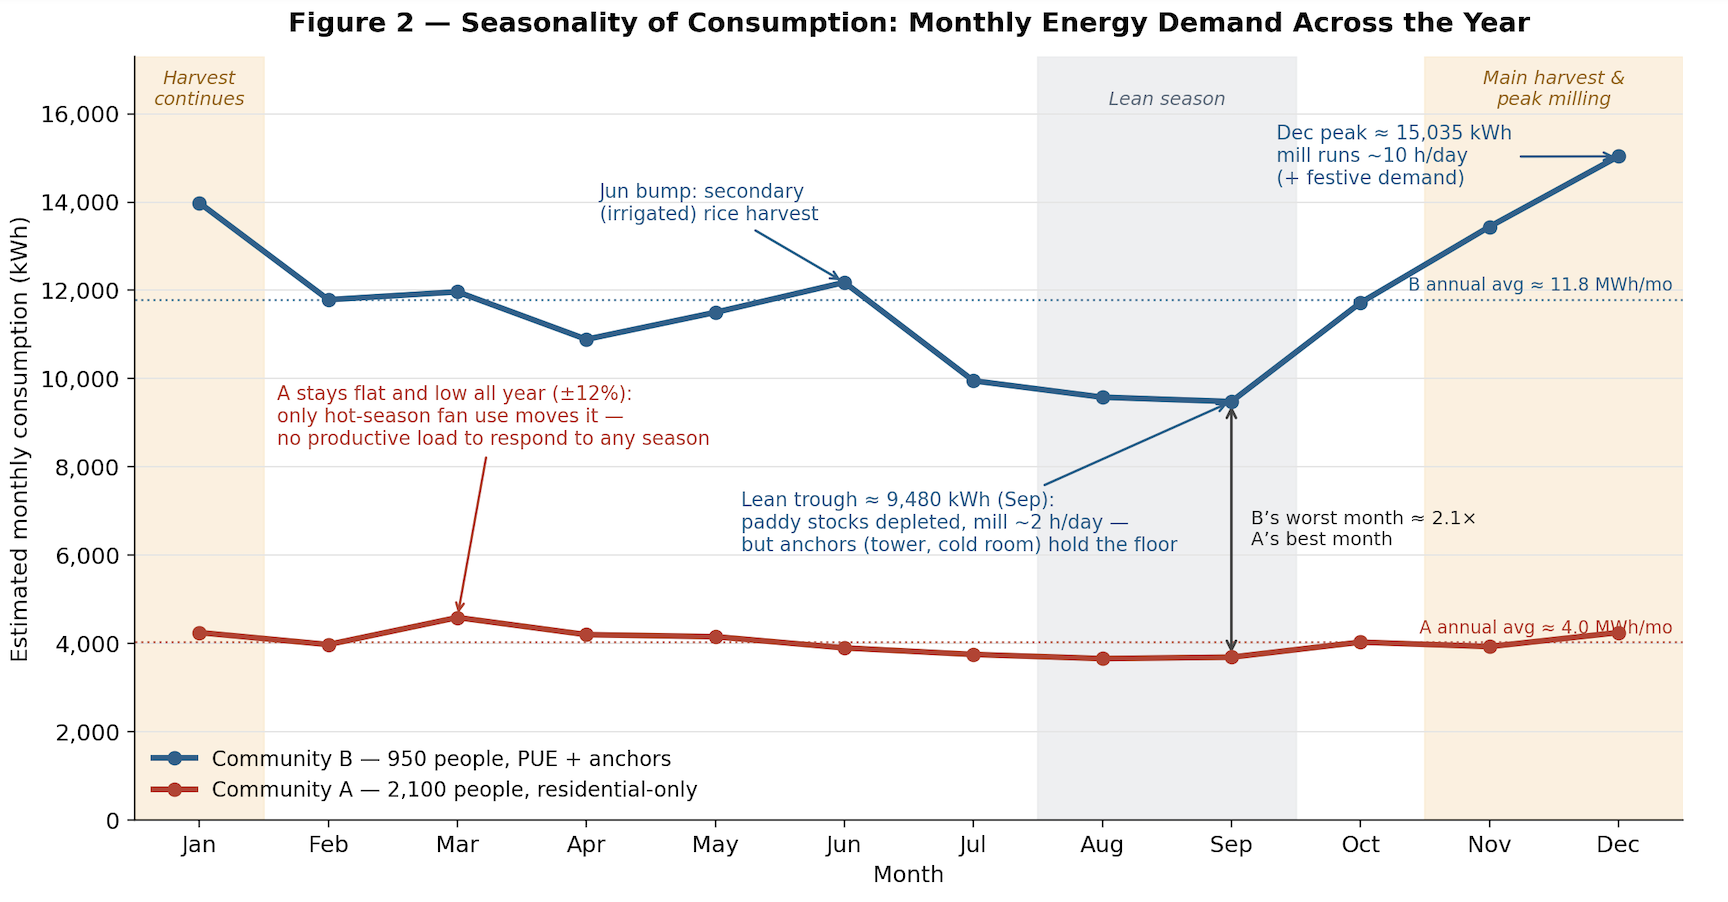
- Seasonality. A rice mill's load collapses outside harvest season. B's design must model monthly load duration curves, not a single "average day" — the backup genset and battery sizing above reflect this.
- Payment risk vs. contract risk. A's revenue is granular (300 small payers, low individual risk, high collection cost). B's is concentrated (anchor default hurts). PPA quality with the tower company matters more than any residential tariff decision.
None of these overturn the central result; they refine how a developer would de-risk Community B.
9. Key Takeaways
- Population is a proxy; demand is the fundamental. A settlement of 950 with a mill, a tower, and a cold room out-earns a settlement of 2,100 without them by 3.5× — with 15× the operating margin.
- Load factor is the single most powerful economic lever. Moving from ~14% to ~38% load factor cuts LCOE by more than half, consistent with ESMAP's published $0.55 → $0.42 → $0.35/kWh curve.
- Daytime, sun-following loads are worth more than evening loads in solar-battery systems, because they bypass the battery.
- Anchor loads (telecom towers, mills, cold chains) transform bankability — they convert a retail utility business into one with contracted, creditworthy baseline revenue.
- Settlement density drives reticulation cost. Revenue per kilometre of line is a screening metric worth institutionalizing.
- Grid distance determines the competitive frontier. Near-grid + low-demand sites belong to grid extension; far-grid + high-demand sites are the minigrid sweet spot.
- The sector's own benchmarks confirm the shift. AMDA's BAM series shows ARPU rising with site maturity and commercial customer mix, and the 2024 edition reports projects growing larger and more sophisticated — the share of member minigrids serving over 500 customers rose from 8% in 2022 to 30% in 2024, reflecting a sector selecting for demand density, not just headcount.
The screening question is no longer "How many people live there?" It is "What does this community do between 9 a.m. and 5 p.m., and what do they currently pay diesel generators to do it?"
Appendix — Assumptions & Sources
Modeling assumptions (transparent and adjustable):
- Household size: 7 persons/HH (rural Nigeria average)
- Residential consumption: 0.35–0.5 kWh/day/HH (Tier 1–2, consistent with observed rural Nigerian minigrid data)
- Tariffs: illustrative cost-reflective USD tariffs; actual tariffs are regulated (e.g., NERC minigrid tariff methodology) and currency-exposed
- Capex norms: PV ~$800–1,000/kWp installed; Li-ion storage ~$200–350/kWh (Nigeria benchmarking found ~$197/kWh in 2018); LV line ~$10,000–12,000/km; connection + meter ~$150; development/soft costs ~15%
- Financing: 15-year horizon, ~10% discount rate for LCOE annualization
- MV grid extension: $15,000–25,000/km (SSA range)
Primary sources:
- ESMAP / World Bank, Mini Grids for Half a Billion People: Market Outlook and Handbook for Decision Makers (2019 Executive Summary; 2022 full edition) — load factor/LCOE curve ($0.55 → $0.42 → $0.35/kWh), 37% LCOE reduction from anchor + pumping loads, $0.22/kWh 2030 pathway
- AMDA, Benchmarking Africa's Minigrids Reports (2020, 2022, 2024) — ARPU trends ($4.29 → $8.30/month for mature sites), connection growth (40,700 → 78,000+), 2024 shift toward larger sites (8% → 30% of sites >500 customers)
- Nigeria Electrification Project (NEP) / REA — performance-based grant structure and minigrid cost norms
- World Bank Multi-Tier Framework (MTF) — consumption tier definitions
Prepared as an analytical case study for sector discussion. All community-level figures are modeled estimates built on published benchmarks.
Comments
Leave a Comment
Have a similar project?
Contact our advisory team to discuss how we can apply these methodologies to your specific context.
Consult With Us